

Information presented on this web page is intended for informational and educational purposes only and is not meant to be taken as legal, financial, investment or tax advice. We do not accept any responsibility for any trading or investment related losses. Please review our disclaimer on before taking action based upon anything you read or see.
A production best practice is evaluating OEE. You will learn crucial lessons on how to methodically enhance your manufacturing process by measuring OEE and the fundamental losses. To help you, we have created this page on the OEE Calculator.
The most effective measure for locating waste, measuring development, and raising industrial equipment productivity is OEE. This “best practices” indicator also shows what portion of the scheduled work time is productive.
A production process that produces only high-quality components as quickly as possible with minimal downtime has an OEE score of 100%.
OEE is helpful as a baseline and a benchmark. OEE may assess how well a production asset performs compared to industry norms. This is in addition to outcomes for various shifts operating on the same or related internal assets.
OEE may be used as a starting point to monitor advancements in a waste reduction for a specific manufacturing asset over time. Come along as we highlight more on the OEE Calculator below.
What is an OEE?
A measure of how well a manufacturer’s activity is run is called overall equipment effectiveness (OEE). In other words, total equipment effectiveness provides a consistent yardstick for monitoring progress while assisting you in identifying a problem in your processes, determining what proportion of production time is genuinely productive, and fixing it. Constant growth is the aim of your OEE measurement.
The benchmark for assessing manufacturing productivity is OEE. In other words, it shows how much of the time spent producing is productive. A 100% OEE score indicates that you are producing only Good Parts as quickly as possible without any Stop Time. That signifies 100% Perfection (only Decent Parts), 100% Efficiency (as quickly as feasible), and 100% Reliability in the OEE lingo (no Stop Time).
How to use the OEE Calculator
You can use the OEE Calculator through the following steps:
- Enter the Actual Machine Speed
- Enter the Design Machine Speed
- Enter the Number of Good Products
- Enter the Total Products Made
- At this point, the OEE calculator will compute the figures and produce the total OEE.
OEE Calculator
Useful Tips for Maintaining an OEE
Any manager’s procedure must include tracking OEE. Manufacturers may reach and sustain high productivity levels by tracking and improving this parameter. However, applying OEE is just as crucial as doing precise computations. The following are some helpful hints for keeping an OEE:
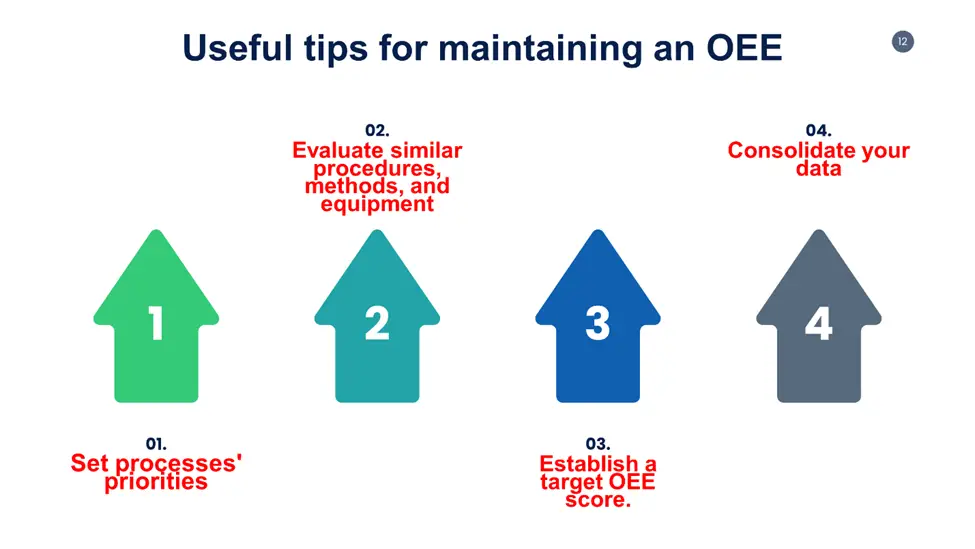
Set processes’ priorities
Setting priorities is the first step in trying to enhance OEE performance. This entails determining the essential tools or procedures that have the greatest impact on profit margins. Calculate OEE for the equipment or process that is the bottleneck.
Evaluate similar procedures, methods, and equipment
The greatest approach to gauge overall productive maintenance is via OEE. However, this won’t work if your measurement process is flawed. Make sure you’re comparing comparable activities, procedures, and tools to begin with. You won’t gain useful information from comparing the OEE numbers of a line with a single changeover daily to a line with three or more.
Establish a target OEE score.
What do OEE scores represent for your operations after they have been calculated? Your objectives will vary from those of an enterprise attempting to raise its world-class score to a flawless 100 percent if you monitor OEE for the first time.
Even while it isn’t a “world-class” score, if equipment production performance is at 45 percent, a rise to 60 percent would be a success. From 45 to 100 percent is a significant increase. Don’t damage your OEE efforts by establishing improbable objectives.
Consolidate your data
Do you still use manual data collection methods? If so, your data is probably outdated and wrong. Up-to-date information on downtime, bottlenecks, reliability and run rates enables managers to see and address issues as they arise.
Sadly, manual methods often provide inaccurate results, drastically restricting data. In an Industry 4.0 environment, moving from manual to automated data gathering is necessary for success.
Five. Add Operators To get the best OEE outcomes, culture is essential throughout OEE adoption. If engaging with line operators during decision-making is not part of your company’s culture, you can prevent OEE outcomes from being maximized.
When production line workers are solicited for their opinions and viewpoints, all stakeholders can better comprehend how the production line functions. Line employees can better comprehend how OEE directly benefits them when they are involved in decision-making. Additionally, it gives individuals a sense of worth, which boosts their confidence and motivation.
Pros & Cons of OEE
The Pros & Cons of OEE have been highlighted in the table below.
| Pros | Cons |
| Return on Investment (ROI) | OEE is not connected to the business goals of the company |
| Aids in preserving your market competitiveness, especially in highly competitive sectors like the production of pharmaceuticals and medical devices. | Real production constraints are not addressed |
| Maximize the functionality of the equipment | OEE is a recurring metric that might be confusing rather than providing clarity in the areas that need improvement. |
| Higher process quality can help you save time and money and help you keep your market reputation. This goes beyond preventing the dangers and repercussions of product recalls. | OEE distorts when it comes to identifying the areas that need improvement and masks the main issues. |
| The capacity to assess and choose | Complex implementation |
| Find the hidden sets | It requires thorough employee training. |
| Makes it easier for everyone working in the production process to do their jobs. Saves money on equipment maintenance and repairs by establishing appropriate plans and timetables. | |
| Scalability | |
| Where your digital factory should have started | |
| Makes sure you make the most of the equipment you already have, minimizing the need for investment in other sectors. | |
| Provides you with a clearer picture of the manufacturing process so you can identify and prioritize the underlying issues. | |
| Provides a large return on investment, whether you’re boosting efficiency, introducing new items, or anything else. | |
| Makes your manufacturing line more scalable. |
Why the Preferred OEE Calculation
Some reasons for the Preferred OEE Calculation include:
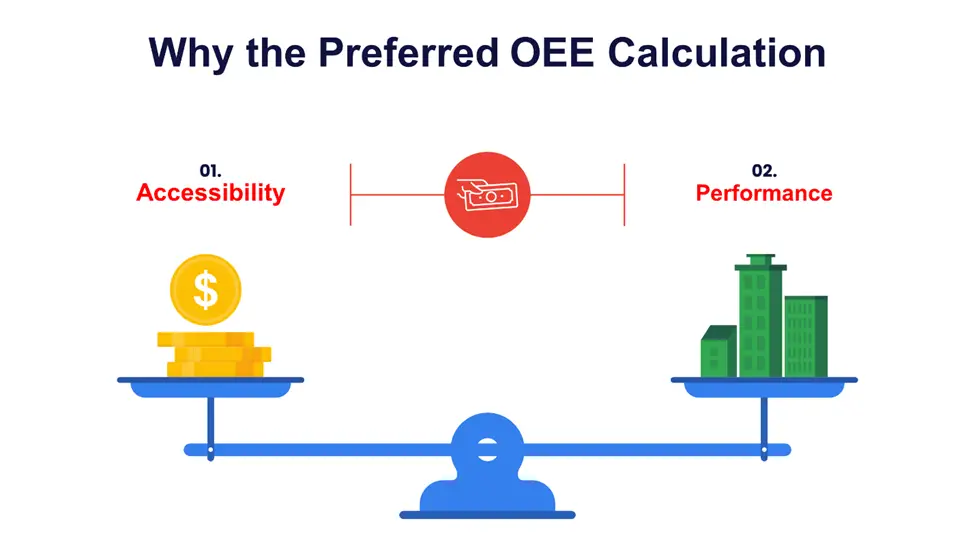
Accessibility
This component considers all occurrences that halt scheduled production for a long time, allowing for the need to identify a cause. The ratio of the Run Time to the Planned Production Time is used to determine availability:
Runtime / Planned Production Time equals availability.
The Run Time is only the Timeless Stop Time for Planned Production. At the same time, Stop Time is the whole time during which the manufacturing process was meant to be in operation. However, this is not the result of unanticipated halts like breakdowns or anticipated stops like changeovers or equipment maintenance times.
Performance
Performance keeps track of everything, preventing a manufacturing process from operating as quickly as possible. Slow cycles and brief pauses are included in this. Performance is thus defined as the ratio of Net Run Time to Run Time. The formula determines performance:
Performance = (Ideal Cycle Time Total Count) / Run Time.
The process’s quickest cycle time can attain under ideal conditions is known as the Ideal Cycle Time. Therefore, the result of multiplying it by the Total count is Net Run Time.
Frequently Asked Questions
What is KPI in OEE?
A KPI is a metric used in OEE manufacturing. It is a measure of a machine’s overall productivity. OEE calculates a score measure for each planned run by comparing a machine’s productivity to its relative potential.
Can OEE be more than 100%?
No. An OEE score of 100% denotes flawless production, which involves producing only high-quality components as quickly as possible without downtime.
Is OEE a good metric?
Yes. OEE aims to enhance manufacturing by giving firms a better knowledge of the losses. It is a statistic that breaks down ostensibly difficult production issues into straightforward, understandable data that aids you in making the best choices to increase productivity and save operating costs.
What is the purpose of OEE?
OEE’s main objective is to track improvements in industrial productivity. Getting rid of rubbish is also a part of this.
Is OEE a good KPI?
Yes. In actuality, between 80 and 85 percent of OEE numbers are regarded as outstanding. Although OEE provides a decent overview of an area’s overall performance, it should still be utilized with care. High OEE numbers should be examined in the context of other metrics.
Expert Opinion
Asset-intensive companies employ the potent statistic OEE (Overall Equipment Efficiency) to assess and gauge their overall production. Companies that use lean manufacturing utilize it as a productivity indicator.
Generating Key Performance Indicators (KPIs) and target areas of development to realize your full potential may be aided by being aware of your baseline OEE. And to use this effectively, the OEE Calculator will aid you immensely.
References


